Image Details
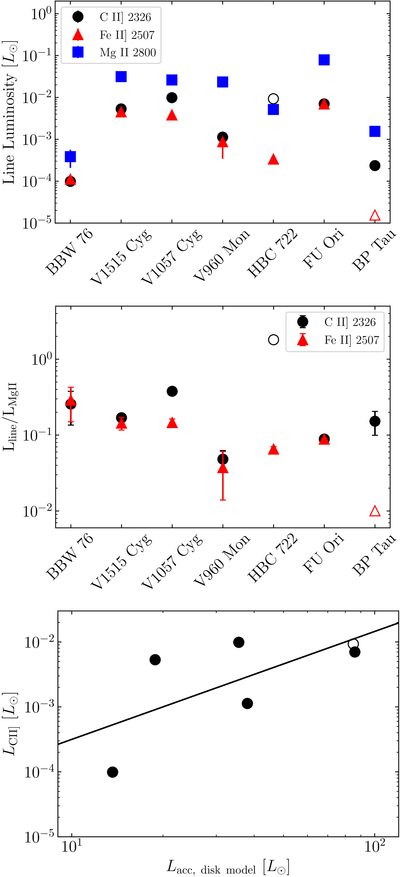
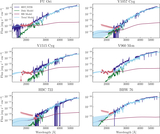
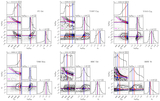
Caption: Figure 4.
Top: the C II] (black circles), Fe II] (red triangles), and Mg II (blue squares) line luminosities for the FUOr sample and the CTTS BP Tau. Error bars are drawn, but are smaller than the symbols for most measurements. The empty circle (triangle) for HBC 722 (BP Tau) represents the 3σ upper limit on the C II] (Fe II]) luminosity. The FUOrs are sorted left-to-right in order of increasing Lacc. Middle: the same line C II] and Fe II] luminosities divided by the Mg II luminosities. Bottom: the LC II] measurements plotted against the Lacc for the FUOrs. The black line shows the best-fit relation described in Section 4.2.
Other Images in This Article
Copyright and Terms & Conditions
© 2025. The Author(s). Published by the American Astronomical Society.