Image Details
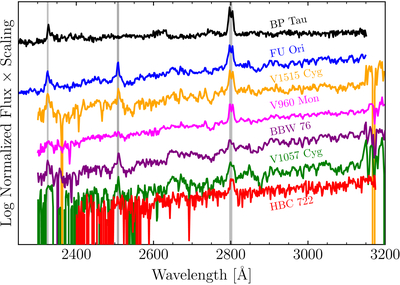
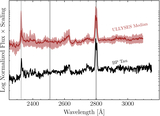
Caption: Figure 3.
The STIS G230L spectra of the six FUOrs and the CTTS BP Tau for reference. The spectra are sorted top-to-bottom in order of decreasing signal-to-noise. The gray vertical lines mark the locations of the emission features discussed in Section 4.
Other Images in This Article
Copyright and Terms & Conditions
© 2025. The Author(s). Published by the American Astronomical Society.
Copyright ©
2025 Astronomy Image Explorer. All Rights Reserved.