Image Details
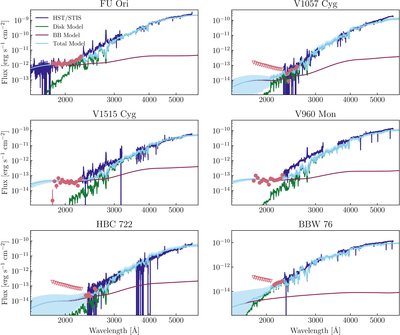
Caption: Figure 1.
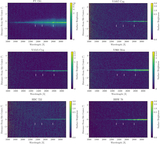
The G230L and G430L spectra for each of our objects (dark blue), along with the disk (green) and disk + UV excess (light blue) models for each of the FUOrs in the survey. The shaded regions show the range of the 16th and 84th percentile models from the Markov Chain Monte Carlo samples. The blackbody component in each panel (maroon) matches the flux level of the binned continuum points (salmon) blueward of 2300 Å. The flux upper limits for V1057 Cyg, HBC 722, and BBW 76 are shown as empty triangles.
Other Images in This Article
Copyright and Terms & Conditions
© 2025. The Author(s). Published by the American Astronomical Society.
Copyright ©
2025 Astronomy Image Explorer. All Rights Reserved.