Image Details
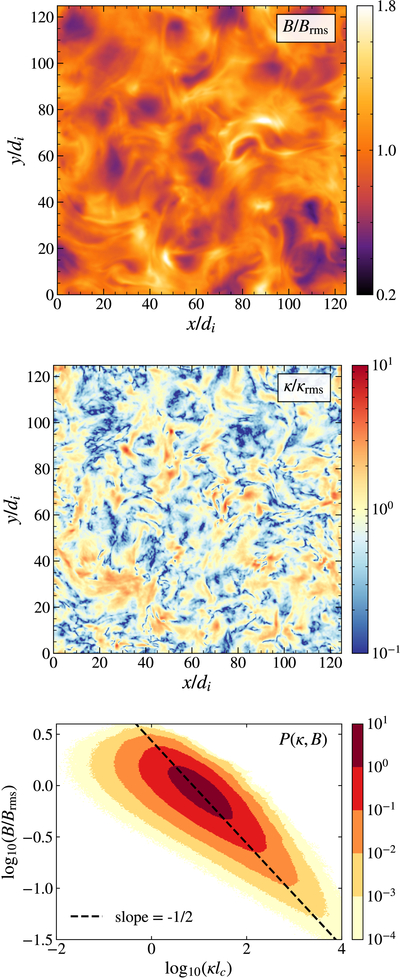
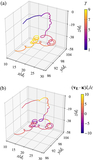
Caption: Figure 4.
Two-dimensional slices in the x–y plane at fixed z from the reference simulation (δB0/B0 = 1) at t = 2 lc/c, showing the normalized magnetic field strength B/Brms and the normalized magnetic field-line curvature magnitude κ/κrms. The bottom panel shows the joint distribution of B/Brms and κ (measured in units of the inverse coherence length, ﹩{l}_{c}^{-1}﹩), showing that regions of strong curvature tend to coincide with weaker magnetic fields. A power-law slope of −1/2 is provided for reference.
Other Images in This Article
Copyright and Terms & Conditions
© 2025. The Author(s). Published by the American Astronomical Society.
Copyright ©
2025 Astronomy Image Explorer. All Rights Reserved.