Image Details
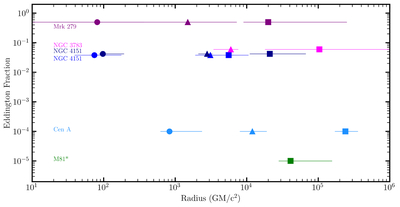
Caption: Figure 5.
A comparison of the inner radii measured for Fe Kα line components in a subset of XRISM spectra of local AGN. All of the radii are based on blurred “mytorus” modeling of Resolve spectra; please see the text for details. With several important caveats, this plot suggests that Resolve data are able to separate line emission from the inner disk, BLR, and torus and capable of tracing trends with Eddington fraction.
Other Images in This Article

Copyright and Terms & Conditions
© 2025. The Author(s). Published by the American Astronomical Society.
Copyright ©
2025 Astronomy Image Explorer. All Rights Reserved.