Image Details
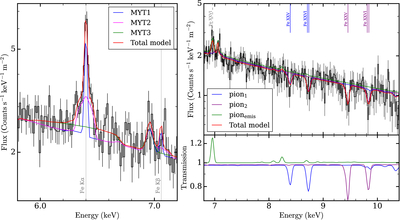
Caption: Figure 4.
The zoomed-in spectrum and the best-fit extended physical model (red), including the breakdown of the components for Fe K emission lines and photoionized emission/absorption lines. The data are plotted in the rest frame.
Other Images in This Article

Copyright and Terms & Conditions
© 2025. The Author(s). Published by the American Astronomical Society.
Copyright ©
2025 Astronomy Image Explorer. All Rights Reserved.