Image Details
Caption: Figure 1.
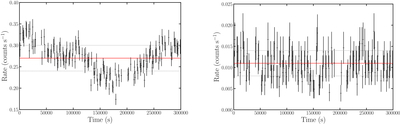
Light curves of the XRISM/Resolve observation of Mrk 279. The left panel shows the light curve of the full Resolve band, and the right panel shows the light curve of the filtered 6.3–6.5 keV band (6.1–6.3 keV in the observed frame). The red horizontal line in each panel indicates the mean rate in each band (0.27 ± 0.03 counts s−1 for the full band, 0.011 ± 0.003 counts s−1 for 6.1–6.3 keV), and the horizontal dotted lines indicate the rms of the variations in each curve.
Other Images in This Article

Copyright and Terms & Conditions
© 2025. The Author(s). Published by the American Astronomical Society.
Copyright ©
2025 Astronomy Image Explorer. All Rights Reserved.