Image Details
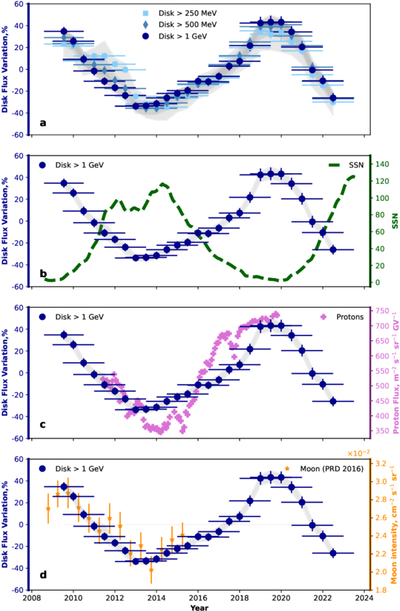
Caption: Figure 1.
Panel (a): percentage of the flux variation of the solar disk component above 25 MeV, 500 MeV, and 1 GeV vs. time in years. For normalization, the average flux values used are 9.15, 4.69, and 2.23 (× 10−8 cm−2 s−1), respectively. The gray regions define systematic uncertainties. Panel (b): flux variation in time of the solar disk component above 1 GeV compared with the SSN. Panel (c): flux variation in time of the solar disk component above 1 GeV compared with the CR proton flux at 2.14–2.4 GV (M. Aguilar et al. 2021). Panel (d): flux variation in time of the solar disk component above 1 GeV compared with the Moon’s flux above 56 MeV (M. Ackermann et al. 2016).
Other Images in This Article
Copyright and Terms & Conditions
© 2025. The Author(s). Published by the American Astronomical Society.