Image Details
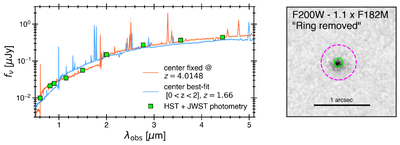
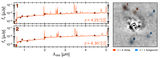
Caption: Figure 5.
Left: flux density vs. observed wavelength, plotting photometric points from the two HST and seven JWST wide-filter images in the green squares. These data are taken from an aperture corresponding to the “center” shown in Figure 3 (and the green circle in the right panel). The orange and blue spectra represent bagpipes models of a galaxy clump at z = 4.0148 vs. a foreground gravitational lens with a best-fit redshift of z = 1.66. The z ≃ 4 solution better describes the photometry, and the predicted source SED at z ≃ 1.7 exhibits a number of lines between 3.2–5.0 μm that are not found in the NIRSpec data (see Figure 2). Right: a scaled version of F182M imaging subtracted from the F200W imaging; we calculate a “corrective factor,” accounting for diffuse starlight near the “center” of the galaxy, from the flux enclosed within the magenta aperture.
Other Images in This Article
Copyright and Terms & Conditions
© 2026. The Author(s). Published by the American Astronomical Society.