Image Details
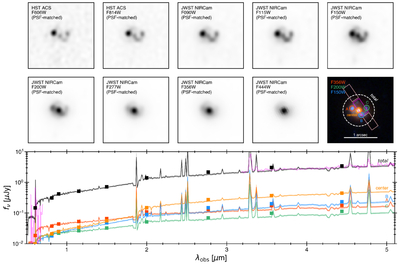
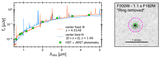
Caption: Figure 3.
Top: 2″ cutouts of HST/ACS and JWST/NIRCam imaging, after matching the spatial resolution to F444W. The bottom-right cutout is the RGB image from Figure 1 at native NIRCam resolution. The scale bar in the RGB cutout applies to all panels. Circles in the RGB panel mark the five apertures used for the multiband photometry and SED modeling: clumps A (red), B (blue), and C (green), the center (orange), and the total flux (white, dashed line). The magenta rectangle indicates the slit for the spectra in Figure 2. Bottom: flux density vs. observed wavelength within each aperture, as color coded in the top panel. A 5% flux uncertainty was multiplied in quadrature to each photometric point before SED fitting. The best-fit SED models from bagpipes, assuming z = 4.0148 for all apertures, are shown as solid lines, demonstrating excellent agreement between the photometry and the spectroscopic redshift from CANUCS (G. T. E. Sarrouh et al. 2026).
Other Images in This Article
Copyright and Terms & Conditions
© 2026. The Author(s). Published by the American Astronomical Society.