Image Details
Caption: Figure 2.
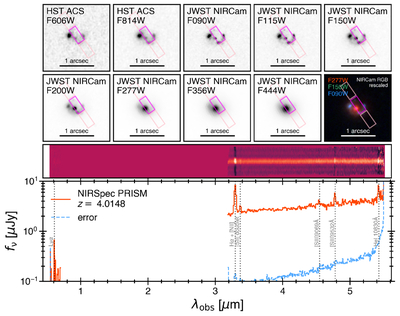
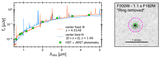
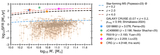
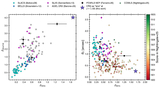
Shown are 2″ cutouts of the ring galaxy as observed by HST/ACS (F606W and F814W) and JWST/NIRCam (F090W, F115W, F150W, F200W, F277W, F356W, and F444W) at their native resolutions. The bottom-right cutout panel shows a rescaled RGB image from the NIRCam data using F277W (red), F150W (green), and F090W (blue) to further highlight the red center vs. blue ring. The magenta box shows the region from which the NIRSpec/PRISM data were taken. These data products (2D spectrum and integrated 1D spectrum) are shown in the bottom half of the figure. We have scaled the contrast in the cutouts and 2D spectra to highlight important features, showing a red continuum exhibiting strong emission lines from a source at z = 4.0148, with emission lines that appear to encompass the spatial extent of the continuum source. The vertical dashed lines indicate the locations of expected emission lines at z = 4.0148, and are included with annotations to demonstrate a match with the spectroscopic redshift of the galaxy.
Other Images in This Article
Copyright and Terms & Conditions
© 2026. The Author(s). Published by the American Astronomical Society.