Image Details
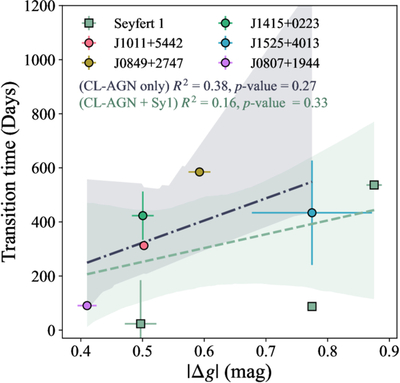
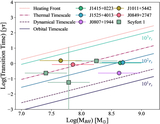
Caption: Figure 8.
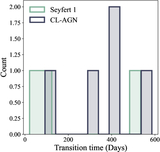
Change in g-band magnitude versus time for photometric transitions to occur for known CL-AGN (colored circles) and Type 1 Seyferts (green squares). We perform linear regressions including only known CL-AGN (purple dashed–dotted line) and including both CL-AGN and Seyfert 1s (green dashed line). We do not detect a correlation between transition magnitude and duration at the 3σ level for either fit.
Other Images in This Article
Copyright and Terms & Conditions
© 2026. The Author(s). Published by the American Astronomical Society.
Copyright ©
2026 Astronomy Image Explorer. All Rights Reserved.