Image Details
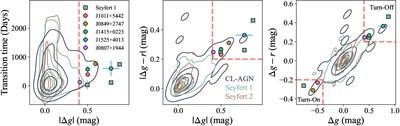
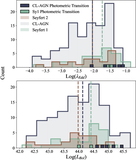
Caption: Figure 5.
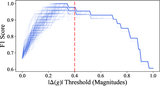
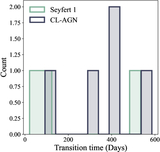
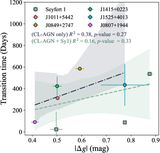
Transition properties across the CL-AGN, Seyfert 1, and Seyfert 2 samples (contours), as well as for individual CL-AGN transition candidates (markers). Left: amplitude of the transition versus its duration. CL-AGN transition candidates have a higher variability amplitude than other AGN variability and have transition durations of a few hundred days. Center: magnitude of the g-band transition versus magnitude of the g − r color transition. Our adopted threshold of ∣Δg∣ > 0.4 mag and ∣Δ(g − r)∣ > 0.2 mag (red dashed line) captures only the most extreme AGN variability. Right: change in g-band versus g − r color. We find three candidate turn-on events (Δg, Δ(g − r) < 0) and five candidate turn-off events (Δg, Δ(g − r) > 0).
Other Images in This Article
Copyright and Terms & Conditions
© 2026. The Author(s). Published by the American Astronomical Society.