Image Details
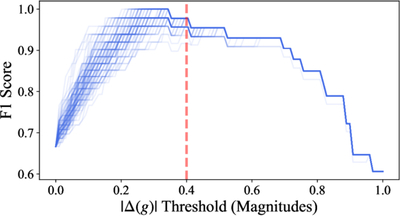
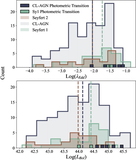
Caption: Figure 4.
F1 score recovered for different photometric transition criteria. An F1 of 1 indicates perfect precision and recall. We estimate the false positive/true negative rate using our simulated damped random walk light curves and the true positive/false negative rate using simulated photometry for observed CL-AGN spectra pre- and post-transition. We account for the imbalance between our damped random walk light curves (∼5000) and the number of CL-AGN with synthetic photometry (23) by randomly sampling 23 light curves 100 times to calculate the number of false positives/true negatives (blue lines). We elect to prioritize purity over completeness, leading to our selected threshold of ∣Δg∣ > 0.4 mag.
Other Images in This Article
Copyright and Terms & Conditions
© 2026. The Author(s). Published by the American Astronomical Society.