Image Details
Caption: Figure 2.
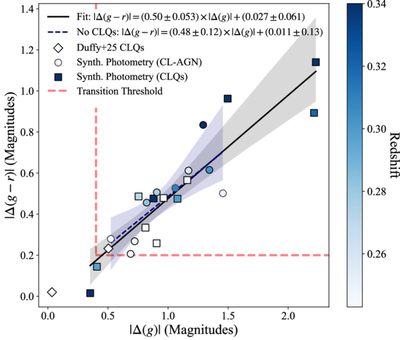
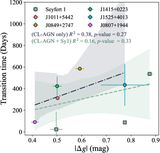
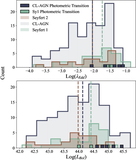
Predicted ZTF color and magnitude changes for CL-AGN with dual-epoch SDSS spectroscopy from S. M. LaMassa et al. (2015), J. J. Ruan et al. (2016), J. C. Runnoe et al. (2016), Q. Yang et al. (2018), and G. Zeltyn et al. (2024); the changing-look quasars from P. J. Green et al. (2022); and the measured changes in ZTF color and magnitude for the two changing-look quasars from L. Duffy et al. (2025a) that fall in our redshift range. The objects exhibit a range of values of ∣Δ(g)∣ and ∣Δ(g − r)∣. Based on this and the results of L. Duffy et al. (2025a), as well as our visual identification, we select thresholds of ∣Δ(g)∣ > 0.4 magnitudes and ∣Δ(g − r)∣ > 0.2 magnitudes (red dotted lines), which would select 22 of 25 CL-AGN shown here. We find that CL-AGN transition amplitudes and colors follow the relation ∣Δ(g − r)∣ = (0.50 ± 0.053)∣Δ(g)∣ − (0.027 ± 0.061) (black line and shaded region). This relation holds within the error bars when CLQs are excluded from the linear fit (blue dotted line and shaded region).
Other Images in This Article
Copyright and Terms & Conditions
© 2026. The Author(s). Published by the American Astronomical Society.