Image Details
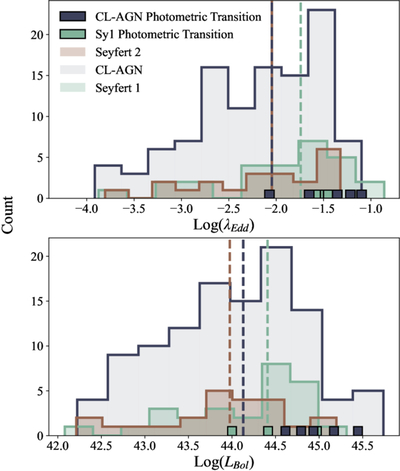
Caption: Figure 10.
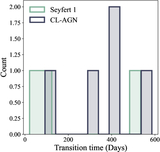
Distribution of Eddington ratios (top) and bolometric luminosities (bottom) for the CL-AGN photometric transition candidates (bar graph) and all objects studied in this work (histograms). Median values for each sample are shown with dashed vertical lines. Photometric transitions occur mainly in objects with an Eddington ratio −2 ≲ Log(λEdd) ≲ −1 (measured from the on-state spectrum). A Kolmogorov–Smirnov test finds photometric transition candidates have marginally statistically distinct Eddington ratios from Seyfert 2s (p = 0.051) and Seyfert 1s (p = 0.035), though CL-AGN overall do not (p = 0.17 for Seyfert 2s and p = 0.22 for Seyfert 1s).
Other Images in This Article
Copyright and Terms & Conditions
© 2026. The Author(s). Published by the American Astronomical Society.