Image Details
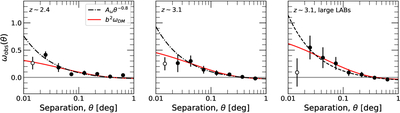
Caption: Figure 4.
Left and middle: observed CCFs between LABs and LAEs at z ∼ 2.4 and z ∼ 3.1. Right: CCF between large LABs and LAEs at z ∼ 3.1. The black dotted–dashed lines indicate the best-fit power-law function (Equation (3), β = 0.8), while the red solid lines show the best-fit results using Equation (6). The open markers denote data points excluded from the fitting.
Other Images in This Article
Copyright and Terms & Conditions
© 2026. The Author(s). Published by the American Astronomical Society.
Copyright ©
2026 Astronomy Image Explorer. All Rights Reserved.