Image Details
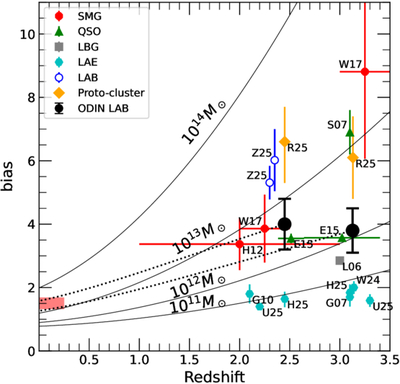
Caption: Figure 3.
Galaxy bias and corresponding halo mass with redshift. The solid lines show the evolution of the bias at a given dark matter halo mass (Equation (8)). The orange diamonds represent protoclusters (R25—V. Ramakrishnan et al. 2025a), and the red octagons represent SMGs (H12—R. C. Hickox et al. 2012; W17—A. Wilkinson et al. 2017). The green triangles are QSOs (S07—Y. Shen et al. 2007; E15—S. Eftekharzadeh et al. 2015). The gray square shows LBGs (L06—K.-S. Lee et al. 2006). The cyan hexagons are LAEs (obtained from G07—E. Gawiser et al. 2007; G10—L. Guaita et al. 2010; W24—M. White et al. 2024; H25—D. Herrera et al. 2025; U25—H. Umeda et al. 2025). The blue open circles represent LABs from H. Zhang et al. (2025—Z25): the lower bias is for their full sample of 39 LABs, and the higher bias is for their subset of bright LABs (slightly shifted for visibility). Our measurements are shown as the large black circles. The dotted lines demonstrate the expected mean growth of dark matter halos (O. Fakhouri et al. 2010). The red shaded region represents the bias of present-day galaxies with (2–4)L⋆ (I. Zehavi et al. 2011). LABs show higher bias than LAEs but smaller than protoclusters. The dark matter halos hosting LABs are expected to evolve into present-day massive halos where low-mass galaxy groups or massive elliptical galaxies reside.
Other Images in This Article
Copyright and Terms & Conditions
© 2026. The Author(s). Published by the American Astronomical Society.