Image Details
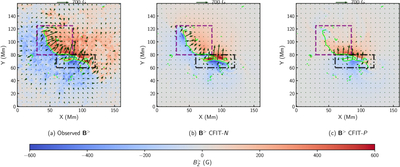
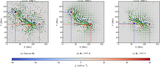
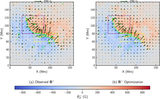
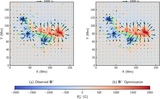
Caption: Figure 3.
The photospheric signatures of coronal currents, B>(x, y, 0), derived from (a) the SHARP photospheric vector magnetogram, (b) the lower boundary data of the CFIT N solution, and (c) the lower boundary data of the CFIT P solution for AR 11429 on 2012 March 6 23:36 UT. The background color map in each panel shows ﹩{B}_{z}^{\gt }(x,y,0)﹩, the black contours show the main PILs corresponding to Bz(x, y, 0) = 0, and the dark green vectors show the horizontal component ﹩{{\boldsymbol{B}}}_{h}^{\gt }(x,y,0)﹩. The color and arrow scales are the same for all the panels. The regions highlighted by the purple and black boxes are discussed in the text.
Other Images in This Article
Show More
Copyright and Terms & Conditions
© 2026. The Author(s). Published by the American Astronomical Society.