Image Details
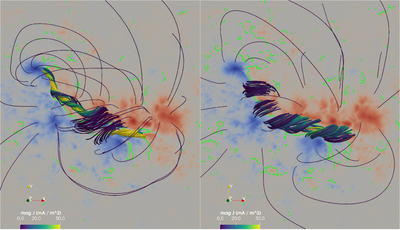
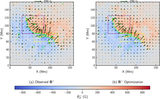
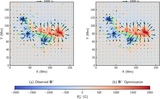
Caption: Figure 2.
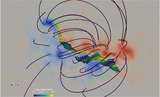
The NLFFF extrapolation of AR 11429 on 2012 March 6 23:36 UT using the CFIT method. The left panel shows the CFIT N solution, and the right panel shows the P solution. The background color map denotes the Bz component at the photosphere, with blue denoting Bz < 0 and red denoting Bz > 0. The green Bz = 0 contours indicate the main PILs. The field lines are colored by the magnitude of the current density J.
Other Images in This Article
Show More
Copyright and Terms & Conditions
© 2026. The Author(s). Published by the American Astronomical Society.
Copyright ©
2026 Astronomy Image Explorer. All Rights Reserved.