Image Details
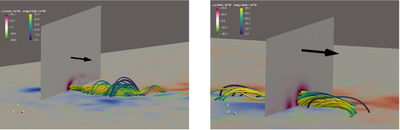
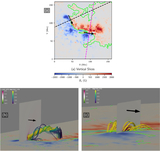
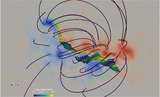
Caption: Figure 13.
Flux rope and associated current density distribution for AR 11429, derived from the optimization solution. The vertical slices considered are the same as those shown in panel (a) of Figure 6. The left panel shows the flux rope and current density in the upper section of the PIL, and the right panel shows the bottom section of the PIL. The field lines are colored by ∣JOPTI(x, y, z)∣ sampled along the line. The normal current density in the vertical slice perpendicular to the PIL, Jn, is shown. Positive values of Jn indicate currents flowing in the direction of the normal vector to the plane. The lower boundary shows Bz(x, y) and the main PIL, similar to previous figures.
Other Images in This Article
Show More
Copyright and Terms & Conditions
© 2026. The Author(s). Published by the American Astronomical Society.