Image Details
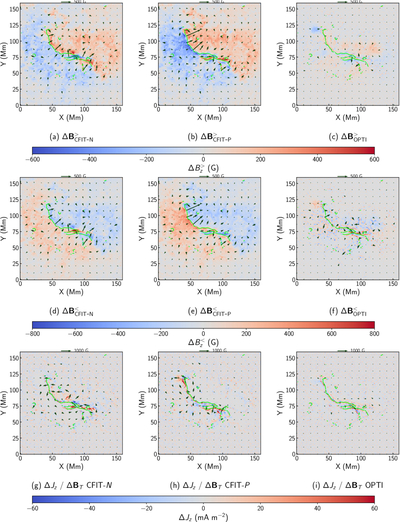
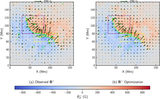
Caption: Figure 12.
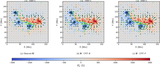
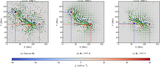
Spatial distribution of the differences between the Gaussian separation components derived from the vector magnetogram and the lower boundary of the models. The background color map in panels (a)–(c) indicates ﹩{\rm{\Delta }}{B}_{z}^{\gt }﹩ for each of the models, and the vectors indicate ﹩{\rm{\Delta }}{{\boldsymbol{B}}}_{h}^{\gt }﹩. Panels (d)–(f) show similar plots for ﹩{\rm{\Delta }}{B}_{z}^{\lt }﹩ and ﹩{\rm{\Delta }}{{\boldsymbol{B}}}_{h}^{\lt }﹩. The background color map in panels (g)–(i) shows ΔJz, with the vectors indicating ΔBT. The green contours in each panel indicate the main PIL.
Other Images in This Article
Show More
Copyright and Terms & Conditions
© 2026. The Author(s). Published by the American Astronomical Society.