Image Details
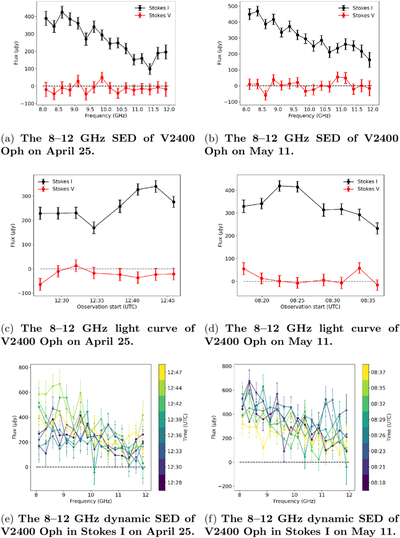
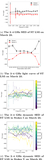
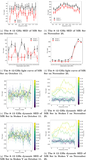
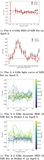
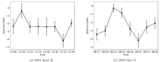
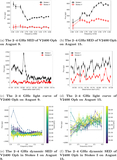
Caption: Figure 7.
The 8–12 GHz data for V2400 Oph on 2019 April 25 (left column) and 2019 May 11 (right column). The top panels show the full-band SEDs, the middle panels show the full-band light curves, and the bottom panels show the dynamic SEDs in Stokes I. There is some moderate variation in each observation, but no obvious flares were detected.
Other Images in This Article
Copyright and Terms & Conditions
© 2026. The Author(s). Published by the American Astronomical Society.
Copyright ©
2026 Astronomy Image Explorer. All Rights Reserved.