Image Details
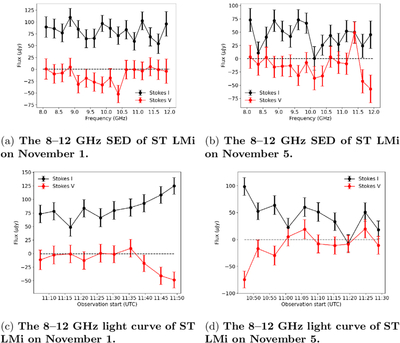
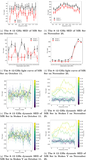
Caption: Figure 3.
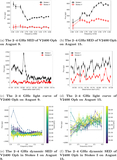
The 8–12 GHz data for ST LMi on 2017 November 1 (left column) and 2017 November 5 (right column). The top panels show the full-band SEDs, while the bottom panels show the full-band light curves. Detections of circular polarization are marginal, but there is an indication of increasing polarization with flux at the end of the first observation and the beginning of the first.
Other Images in This Article
Copyright and Terms & Conditions
© 2026. The Author(s). Published by the American Astronomical Society.
Copyright ©
2026 Astronomy Image Explorer. All Rights Reserved.