Image Details
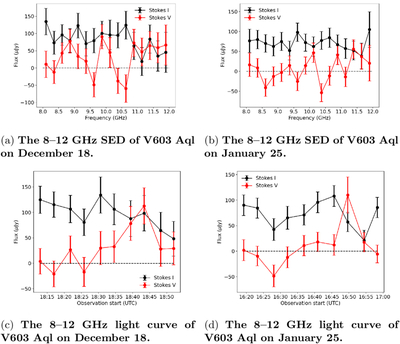
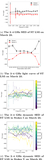
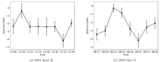
Caption: Figure 10.
The 8–12 GHz data for V603 Aql on 2017 December 18 (left column) and 2018 January 25 (right column). The top panels show the full-band SEDs, while the bottom panels show the full-band light curves. There are no clear flares, but the light curves show slight variation.
Other Images in This Article
Copyright and Terms & Conditions
© 2026. The Author(s). Published by the American Astronomical Society.
Copyright ©
2026 Astronomy Image Explorer. All Rights Reserved.