Image Details
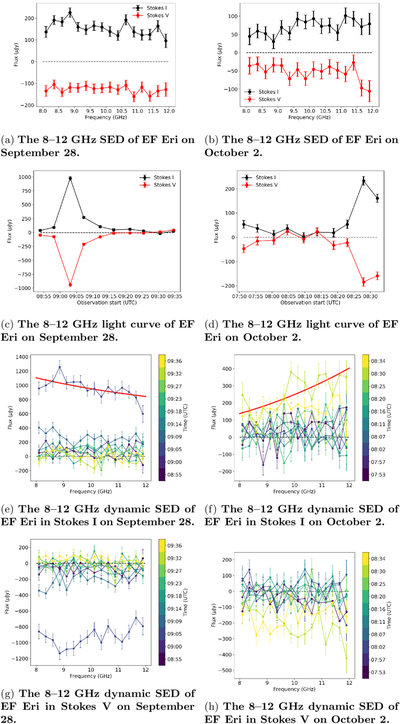
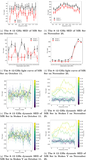
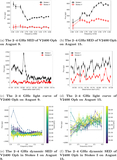
Caption: Figure 1.
The 8–12 GHz data for EF Eri on 2017 September 28 (left column) and 2017 October 2 (right column). The top panels show the full-band SEDs, the second panels show the full-band light curves, the third panels show the Stokes I dynamic SEDs, and the bottom panels show the Stokes V dynamic SEDs. One flare was detected in each 8–12 GHz observation of EF Eri. Both produced broadband LCP emission. The SEDs at the peak of each flare were fit in Stokes I to calculate the spectral index, shown in red on panels (e) and (f). These are α = −0.7 ± 0.2 for September 28 and α = 2.7 ± 0.8 for October 2.
Other Images in This Article
Copyright and Terms & Conditions
© 2026. The Author(s). Published by the American Astronomical Society.
Copyright ©
2026 Astronomy Image Explorer. All Rights Reserved.