Image Details
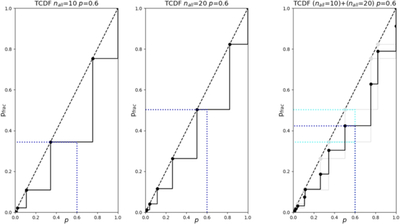
Caption: Figure 3.
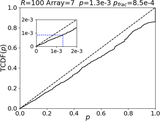
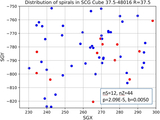
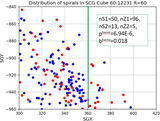
The left and middle panels show the theoretical binomial OCDF for cubes with nall = 10 and nall = 20, respectively, where the steps of the distribution intersect the diagonal dashed line corresponding to the normal distribution. The right panel shows the OCDF for a combined set of the two cubes, in which the steps deviate from the normal distribution line. The probability of obtaining an asymmetry with pS ≤ 0.3, for example, is obtained by reading the corresponding vertical value of the OCDF in each panel. Note that the OCDF for the theoretical binomial distribution lies below the normal distribution line due to its discrete nature.
Other Images in This Article
Copyright and Terms & Conditions
© 2026. The Author(s). Published by the American Astronomical Society.