Image Details
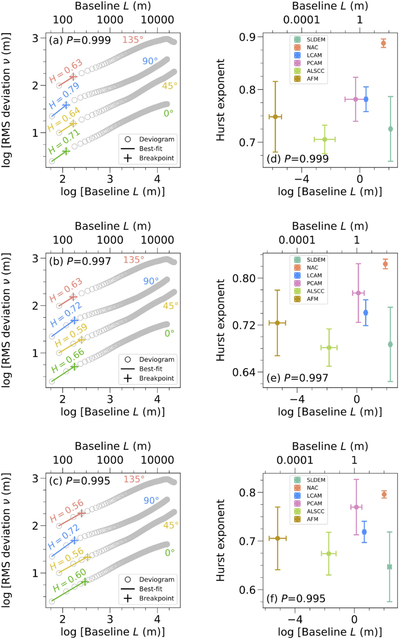
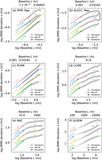
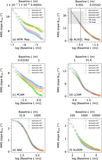
Caption: Figure A18.
Deviograms of the SLDEM ROI under Pearson correlation coefficients of 0.999 (panel (a)), 0.997 (panel (b)), and 0.995 (panel (c)). Hurst exponents as a function of baseline under Pearson correlation coefficients of 0.999 (panel (d)), 0.997 (panel (e)), and 0.995 (panel (f)).
Other Images in This Article
Show More
Copyright and Terms & Conditions
© 2026. The Author(s). Published by the American Astronomical Society.
Copyright ©
2026 Astronomy Image Explorer. All Rights Reserved.