Image Details
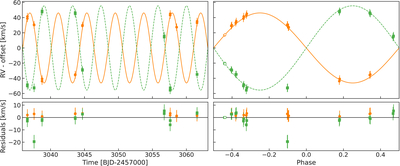
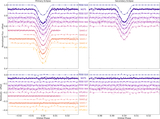
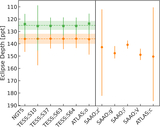
Caption: Figure 9.
Top-left panel: the NIRPS radial velocity data against time. Top-right panel: the phase-folded NIRPS and GHOST radial velocity data. The RVs for the primary star are shown as orange circles (NIRPS: solid circles; GHOST: open circles), and the median allesfitter model for the High k-range model is shown as a solid orange line. The RVs for the secondary star are shown as green squares (NIRPS: solid squares; GHOST: open squares), and the median allesfitter model is shown as a dashed green line. Bottom panels: residuals for the RVs shown in both panels.
Other Images in This Article

Show More
Copyright and Terms & Conditions
© 2025. The Author(s). Published by the American Astronomical Society.
Copyright ©
2025 Astronomy Image Explorer. All Rights Reserved.