Image Details
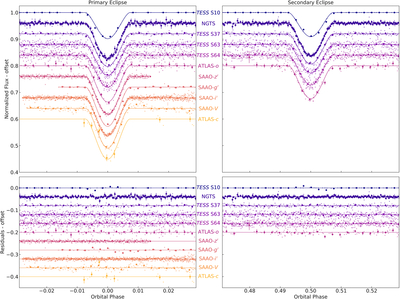
Caption: Figure 8.
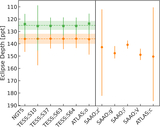
Discovery and follow-up photometry obtained for NGTS-EB-8. Top-left panel: phase-folded photometry for the primary eclipse in each instrument, offset for clarity. Binned data in 2 minute bins for NGTS and 15 minute bins for all other instruments is shown as solid circles, with raw data shown as lower opacity points. The median best-fit allesfitter model for the High k-range model is shown as a solid line for each photometric data set. Top-right panel: phase-folded photometry for the secondary eclipse in each instrument it was observed, offset for clarity. Bottom panels: residuals for the primary and secondary eclipses in each instrument, offset for clarity. The photometric data are provided as the data-behind-the-figure.
(The data used to create this figure are available in the online article.)
(The data used to create this figure are available.)
Other Images in This Article

Show More
Copyright and Terms & Conditions
© 2025. The Author(s). Published by the American Astronomical Society.