Image Details
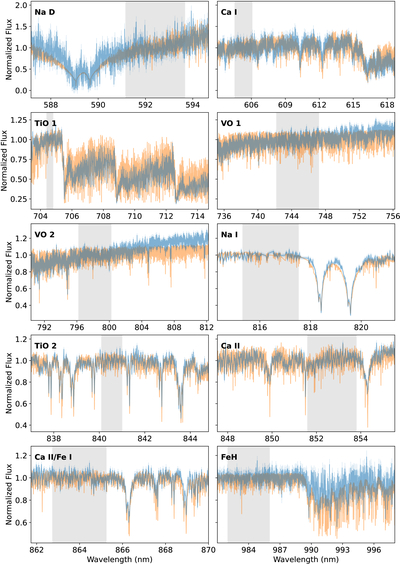
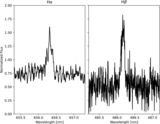
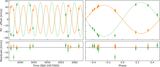
Caption: Figure 15.
Spectral fits for each region defined in Table 3. The first GHOST spectrum of NGTS-EB-8 is shown in blue. The best-fitting SB2 template is shown in orange. The gray regions in each panel show the normalization range.
Other Images in This Article

Show More
Copyright and Terms & Conditions
© 2025. The Author(s). Published by the American Astronomical Society.
Copyright ©
2025 Astronomy Image Explorer. All Rights Reserved.