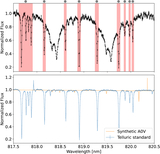
Image Details
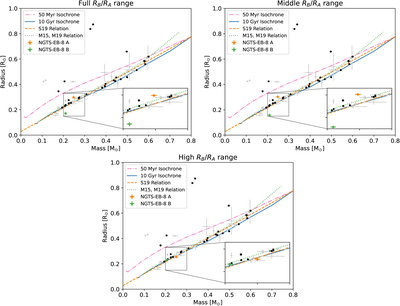
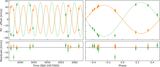
Caption: Figure 12.
Mass–radius diagrams of low-mass stars in double-lined eclipsing binary systems composed of two M dwarfs with the position of the components of NGTS-EB-8 shown for the different k-range models in each panel. In all panels, black points show stars with both mass and precision measured to better than 2%. Light-gray points show all other stars found in the literature search (see Table 7). NGTS-EB-8 A is shown as an orange star. NGTS-EB-8 B is shown as a green star. The 50 Myr and 10 Gyr isochrones from I. Baraffe et al. (2015) are plotted as dashed–dotted pink and solid blue lines, respectively. The relation from A. Schweitzer et al. (2019) is shown as a dashed orange line. The relation derived from A. W. Mann et al. (2015) and A. W. Mann et al. (2019) is shown as a dotted green line. Top-left panel: positions of NGTS-EB-8 shown as determined by the Full k-range model. Top-right panel: positions of NGTS-EB-8 shown as determined by the Middle k-range model. Bottom panel: positions of NGTS-EB-8 shown as determined by the High k-range model.
Other Images in This Article

Show More
Copyright and Terms & Conditions
© 2025. The Author(s). Published by the American Astronomical Society.