Image Details
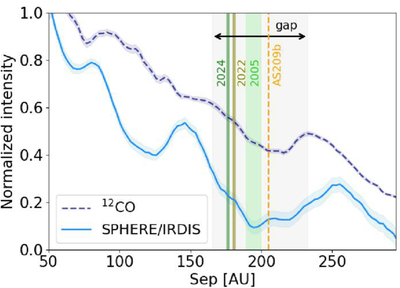
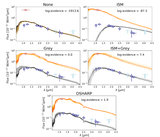
Caption: Figure 9.
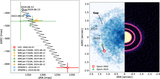
AS 209 disk intensity profile in polarized H-band scattered light (solid light blue line, H. Avenhaus et al. 2018) and peak intensity of 12CO (dashed dark blue line, obtained by azimuthally averaging the unobscured east side of the data from S. M. Andrews et al. 2018; V. V. Guzmán et al. 2018 with the GoFish package, R. Teague 2019). Vertical shaded areas report the radial location (1σ uncertainties) of AS 209bkg in the three epochs presented in this paper, while the dashed orange line shows the radial separation of AS 209b (J. Bae et al. 2022). The gray area shows the inner and outer radius of the wide gap observed in the disk (V. V. Guzmán et al. 2018; H. Avenhaus et al. 2018).
Other Images in This Article
Copyright and Terms & Conditions
© 2025. The Author(s). Published by the American Astronomical Society.