Image Details
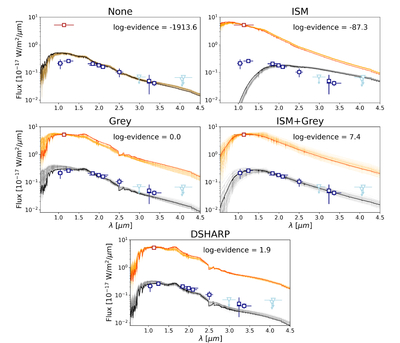
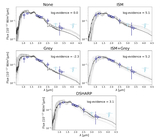
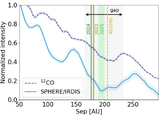
Caption: Figure 8.
Same as Figure 7, with the addition of the red square representing the 2005 HST detection, and orange lines that represent the random sample and best-fit model for the 2005 epoch. In this case, the “Gray” model is used to benchmark the Bayesian log-evidences.
Other Images in This Article
Copyright and Terms & Conditions
© 2025. The Author(s). Published by the American Astronomical Society.
Copyright ©
2025 Astronomy Image Explorer. All Rights Reserved.