Image Details
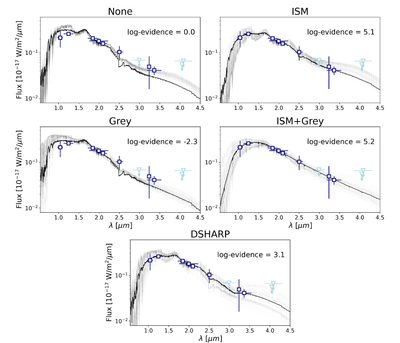
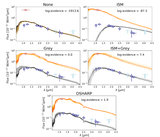
Caption: Figure 7.
SED fits for AS 209bkg using multiple extinction models. In each panel, the observed fluxes are reported in blue squares, while detection limits are shown in light blue arrows. The F300M detection limits, potentially impacted by the 3.0 μm water-ice band, is shown for completeness but is not used in the fit. The best-fit model is shown with a black line, while 100 random samples drawn by the posterior distribution are shown in gray. The log-evidence with respect to the “None” scenario (top left) is reported in each panel.
Other Images in This Article
Copyright and Terms & Conditions
© 2025. The Author(s). Published by the American Astronomical Society.
Copyright ©
2025 Astronomy Image Explorer. All Rights Reserved.