Image Details
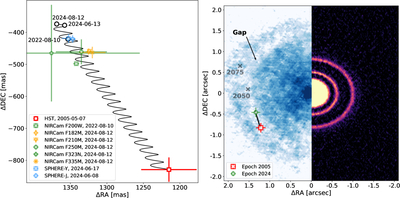
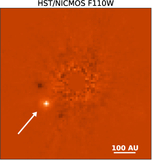
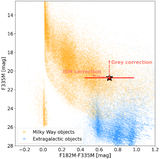
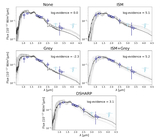
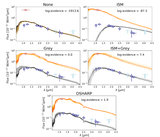
Caption: Figure 5.
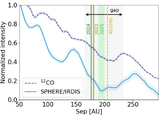
Astrometry of the AS 209 system. Left: proper motion analysis of AS 209bkg. The red square represents the location of the source in 2005. The black line shows the expected trajectory from 2005 through 2024 assuming it is a stationary object, with the expected locations at the SPHERE and NIRCam epochs highlighted with black circles. The NIRCam and SPHERE data agree with the prediction (when considering the HST uncertainties), demonstrating that the source is indeed a background object. Right: projected location of AS 209bkg in the AS 209 disk. On the right side, the millimeter image is reported, showcasing a series of dust rings (S. M. Andrews et al. 2018). On the left side, the CO gas as measured by the DSHARP program (S. M. Andrews et al. 2018; V. V. Guzmán et al. 2018) is reported. AS 209bkg shines through the deep outer CO gap. Gray crosses mark the expected position of AS 209bkg in 2050 and 2075.
Other Images in This Article
Copyright and Terms & Conditions
© 2025. The Author(s). Published by the American Astronomical Society.