Image Details
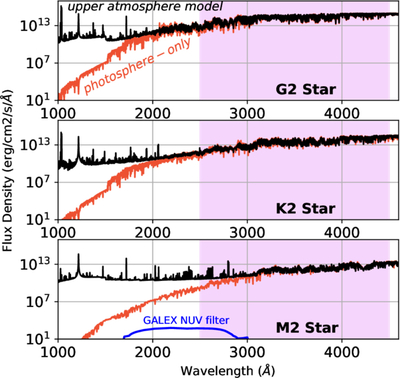
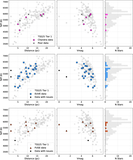
Caption: Figure 8.
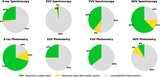
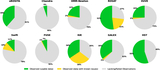
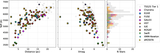
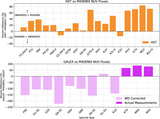
PHOENIX model spectra for G, K, and M stars with (black) and without (red) extended upper atmospheres (i.e., chromosphere and transition region). NUV wavelengths used in HWO-yield analyses are highlighted in purple. We plot the GALEX NUV transmission curve in the bottom panel for reference. Models similar to the red spectra were used to estimate NUV fluxes in narrow bands for HPIC catalog stars. These models tend to underpredict UV fluxes, though the effect is more pronounced for M stars (which represent a small fraction of likely HWO targets) and at FUV wavelengths (not relevant for the yield analyses).
Other Images in This Article

Show More
Copyright and Terms & Conditions
© 2025. The Author(s). Published by the American Astronomical Society.