Image Details
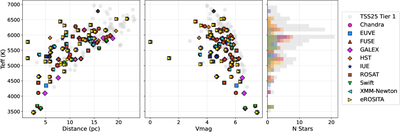
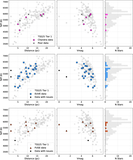
Caption: Figure 7.
Demographics of stars with usable-quality observations from each observatory, compared to the full TSS25 Tier 1 target list. All panels show stellar effective temperature (Teff) on the y-axis. Left panel: Teff vs. distance. Middle panel: Teff vs. V-band magnitude. Right panel: histogram of the number of stars per Teff bin. Different observatories are indicated by distinct colors and symbols, and stack vertically if a star has usable-quality data from multiple observatories. Histogram bars start at zero and show the total number of stars in each Teff bin. Versions of this figure with each observatory shown individually are provided in the Appendix.
Other Images in This Article

Show More
Copyright and Terms & Conditions
© 2025. The Author(s). Published by the American Astronomical Society.