Image Details
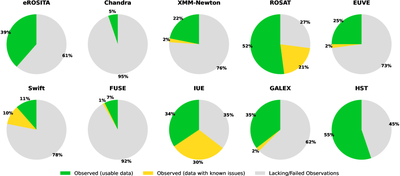
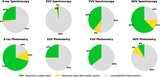
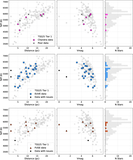
Caption: Figure 6.
Breakdown of data availability for the target stars by observatory. Each pie chart shows the fraction of stars with usable-quality data (green), data with known issues (yellow), and missing or failed observations (gray), normalized over the full sample of 98 stars. For each observatory, the best available data quality per star is used when multiple observations exist.
Other Images in This Article

Show More
Copyright and Terms & Conditions
© 2025. The Author(s). Published by the American Astronomical Society.
Copyright ©
2025 Astronomy Image Explorer. All Rights Reserved.