Image Details
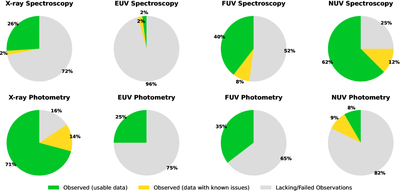
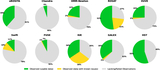
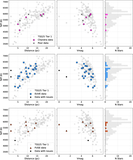
Caption: Figure 5.
Data availability distributions across four wavelength bands (X-ray, EUV, FUV, NUV) and two data types (spectroscopy and photometry). Each pie chart shows the percentage of the full 98-star sample that falls into three categories: usable-quality data (green), data with known issues (yellow), and missing or failed observations (gray). The best available quality per star is used for each band+type combination.
Other Images in This Article

Show More
Copyright and Terms & Conditions
© 2025. The Author(s). Published by the American Astronomical Society.
Copyright ©
2025 Astronomy Image Explorer. All Rights Reserved.