Image Details
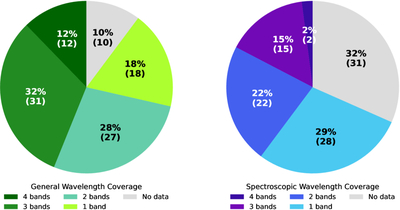
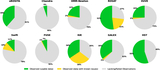
Caption: Figure 4.
Left chart: distribution of stars by the number of wavelength bands (X-ray, EUV, FUV, NUV) with usable observations (either spectroscopy or photometry). Each star is counted once based on how many distinct bands it has good data in. The “No data” category captures stars that lack usable observations in any of the four bands, this includes stars that are limited to data with “known issues.” Both the percentage of the full target sample and the total number of stars are indicated within each wedge. Right chart: the distribution of stars limited to spectroscopy.
Other Images in This Article

Show More
Copyright and Terms & Conditions
© 2025. The Author(s). Published by the American Astronomical Society.
Copyright ©
2025 Astronomy Image Explorer. All Rights Reserved.