Image Details
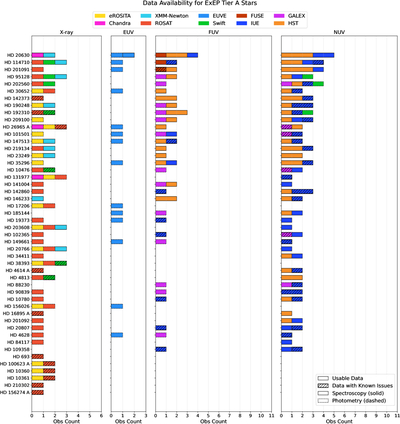
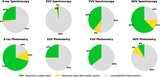
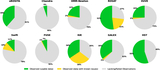
Caption: Figure 2.
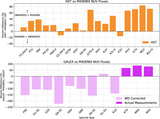
Data availability across X-ray, EUV, FUV, and NUV wavelength ranges for ExEP Tier A stars, ordered by total number of observations (highest at top). Each colored block represents an individual observation, color-coded by observatory. Solid blocks indicate usable data, while hatched blocks denote flagged data with known issues. These include observations of unresolved binaries (Swift, XMM-Newton), upper limits (Swift), or data requiring linear corrections (GALEX). Blocks with solid outlines represent spectroscopic measurements (including APEC model spectra for Chandra and XMM-Newton observations), while dashed outlines represent photometry. Subplots reflect different wavelength bands.
Other Images in This Article
Show More
Copyright and Terms & Conditions
© 2025. The Author(s). Published by the American Astronomical Society.