Image Details
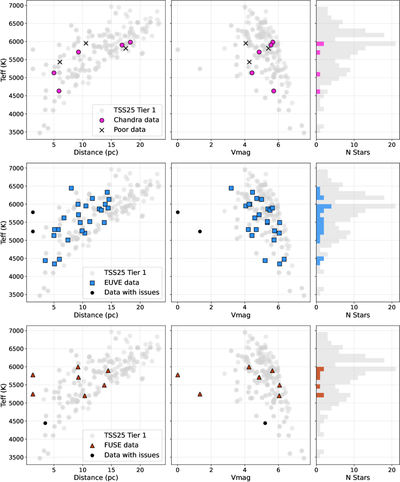
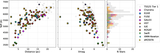
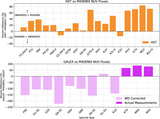
Caption: Figure 10.
The same as Figure 7, but showing each observatory individually. Top panels: demographics of stars with observations from Chandra. Middle panels: EUVE. Bottom panels: FUSE. In each panel, Teff is plotted against distance (left), V-band magnitude (middle), and the number of stars per Teff bin (right). Histogram bars begin at zero and only count usable-quality data. Usable-quality data are shown in color with the corresponding observatory symbol. Observations with known issues (e.g., unresolved binaries or upper limits) are shown as black filled circles. Poor-quality data or failed observations are indicated with black Xs.
Other Images in This Article

Show More
Copyright and Terms & Conditions
© 2025. The Author(s). Published by the American Astronomical Society.