Image Details
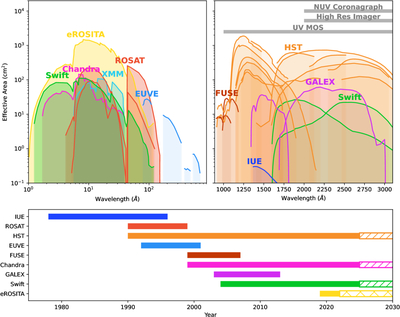
Caption: Figure 1.
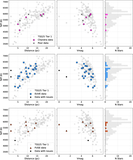
Effective area curves for all observatories used in this analysis. Gray bars mark the tentative wavelength coverage for HWO instruments: the UV Multi-Object Spectrograph (MOS; ∼1000–10000 Å), High Resolution Imager (∼2000–25000 Å), and possible NUV coronagraph (∼2000–4000 Å). Top-left panel: effective area as a function of log wavelength for X-ray to EUV instruments. Top-right panel: effective area in the UV, shown in linear wavelength space. (Only one effective area curve was available for IUE.) Bottom panel: operational lifetimes of each observatory, ordered by commissioning date. Solid bars indicate periods of active observation; hatched extensions denote projected future lifetimes. We note that eROSITA operations have been paused since early 2022.
Other Images in This Article

Show More
Copyright and Terms & Conditions
© 2025. The Author(s). Published by the American Astronomical Society.