Image Details
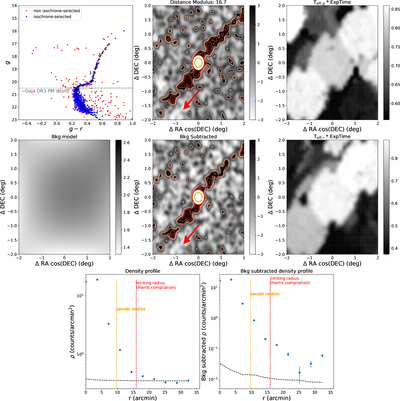
Caption: Figure 2.
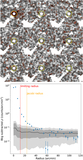
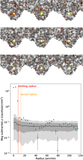
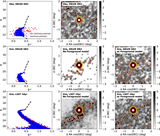
Top left: a color–magnitude diagram of the 1000 closest stars to the center of Pal 5, after excluding those with bad photometry (Source Extractor parameter FLAGS > 3; see Section 2.1). A cubic spline interpolation along the CMD of the cluster is shown as a dashed black line, and sources with photometry consistent with being within 0.05 mag of this fitted function are in blue. The rough depth of usable Gaia DR3 proper motions (g ∼ 20.5) is indicated with a dashed gray line. The MIST isochrone with the closest age and metallicity to the values in the W. E. Harris (1996) catalog is shown as a light red line. Top middle: a density map of all sources within a 4° box around Pal 5, scaled by the standard deviation of the source density. Contours correspond to 2σ, 3σ, 5σ, 7σ, 10σ, 50σ, and 100σ overdensities. The central King limiting radius rt of the GC is masked and circled in red, and the orange circle corresponds to the Jacobi radius calculated in this work (Section 2.3). The red arrow indicates the direction of the systemic proper motion of Pal 5. Top right: a map of the effective exposure time (teff × Texp) in DELVE DR2 for the g-band photometry over the same region as the middle panels. Middle left: a background model for the top middle panel, derived by fitting a second-order two-dimensional polynomial between >4 rt and the entire 4° × 4° field of view. Middle: background-subtracted source density plot. Middle right: a map of the effective exposure time (teff × Texp) in DELVE DR2 for the r-band photometry over the same region as the middle panels. Bottom left: angular-averaged source density plot of the top middle panel, with the limiting radius derived from W. E. Harris (1996) marked in red, and the Jacobi radius calculated in Section 2.3 in yellow. The error bars on the data points are the standard error in the spatial bins averaged (1﹩\mathop{.}\limits^{{\rm{^{\prime} }}}﹩8) over the annulus, in steps of 3﹩\mathop{.}\limits^{{\rm{^{\prime} }}}﹩6. The dashed line corresponds to the background value plus the standard error. Bottom right: same as bottom left, but for the background-subtracted density plot.
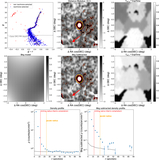
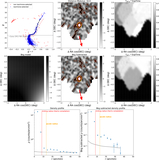
Other Images in This Article
Copyright and Terms & Conditions
© 2025. The Author(s). Published by the American Astronomical Society.