Image Details
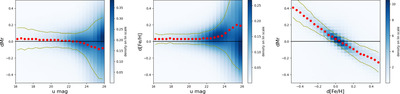
Caption: Figure 14.
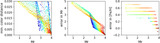
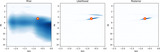
The variation of the difference between the true and estimated values (left: Mr, middle: [Fe/H]) with u-band magnitude. The binned background map shows the same simulated sample as in Figure 11. The symbols show binned medians and the dashed lines show robust standard deviation around the medians. At about u = 23, the scatter for both Mr and [Fe/H] starts increasing due to increasing u-band measurement error. The dataset was generated assuming a u-band 5σ limiting depth of 25.73 for coadded LSST photometry (F. B. Bianco et al. 2022). The right panel illustrates a strong anticorrelation between the differences.
Other Images in This Article
Show More
Copyright and Terms & Conditions
© 2025. The Author(s). Published by the American Astronomical Society.