Image Details
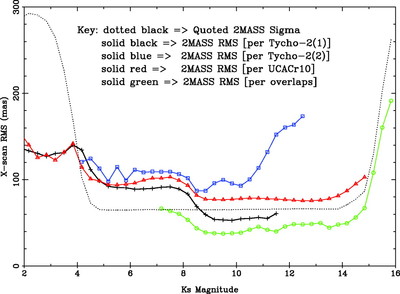
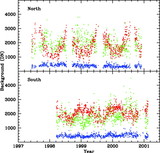
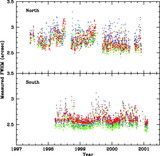
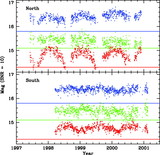
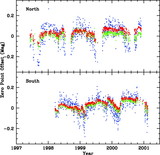
Caption: Fig. 20.
Astrometric comparison between 2MASS and other catalogs as a function of 2MASS Ks magnitude. The solid black curve indicates rms position differences in the cross‐scan (right ascension) direction between 2MASS and the subset of Tycho‐2 stars that appeared in Tycho‐1 [Tycho‐2(1)], while the blue curve is for sources appearing in Tycho‐2 [Tycho‐2(2)]. This latter subset did not appear in Tycho‐1 and thus includes fainter stars with poorer position estimates. Position residuals with UCAC are indicated in red. The green line represents internal 2MASS position differences between adjacent tiles. Analysis of the component of position error along the scan direction yields similar results.
Other Images in This Article

Show More
Copyright and Terms & Conditions
© 2006. The American Astronomical Society. All rights reserved. Printed in U.S.A.