Image Details

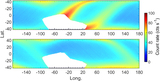
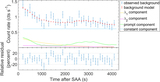
Caption: Figure 11.
Satellite tracks of one group of light curves in the world map. The red lines are a group of light curves of 4.5 ks; their tracks are almost the same with a difference <4°. The green line is the border of the SAA. To fit the delayed background of this group of light curves, data in the most recent 100 ks are selected as the input data of the parametric model, drawn as blue lines. The data of the coastline in the background of this figure are provided by the ETOPO1 Global Relief Model of NOAA (Amante & Eakins 2009).
Other Images in This Article
Show More
Copyright and Terms & Conditions
© 2021. The American Astronomical Society. All rights reserved.
Copyright ©
2024 Astronomy Image Explorer. All Rights Reserved.