Image Details
Erratum: “The Flare Catalog and the Flare Activity in the Kepler Mission” (2019, ApJS, 241, 29)
2020 The Astrophysical Journal Supplement Series 250 25.
- Provider: AAS Journals
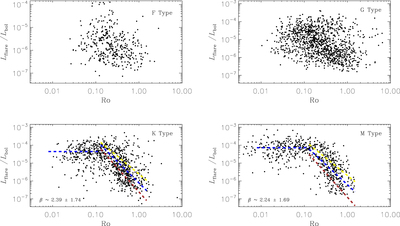
Caption: Figure 5.
Flare activity vs. Rossby number. The stars are grouped by the spectral type. The τ of the Rossby number is according to Table 2 of Wright et al. (2011). Blue lines are obtained by the ordinary least-squares bisector fitting in the log–log plane. The error reflects the uncertainty of the parameter whose deviation of χ2 from its best-fit value reaches Δχ2 = 1. The turnoff point is Ro = 0.13 as suggested by Wright et al. (2011). The index β indicates the slope of the unsaturated regime of the blue line. Red lines and yellow lines are with β = 2.7 and β = 2.0, respectively, for comparison, which have been vertically shifted for clarity.
Other Images in This Article
Copyright and Terms & Conditions
© 2020. The American Astronomical Society. All rights reserved.