Image Details
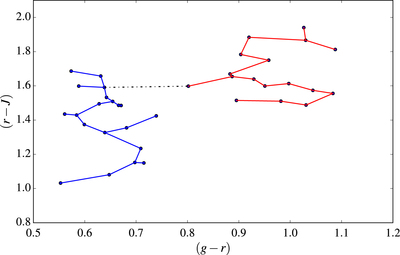
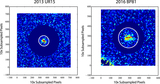
Caption: Figure 5.
Minimal spanning tree, and subtrees determined by the FOP test applied to the optical and NIR colors as shown in Figure 4. The branches connecting members of the two subclasses identified by the test are shown in blue and red lines, respectively. The one branch of the full tree that is cut to result in the two subtrees is shown by the dashed black line.
Other Images in This Article

Copyright and Terms & Conditions
© 2019. The American Astronomical Society. All rights reserved.
Copyright ©
2024 Astronomy Image Explorer. All Rights Reserved.